
Analysis of Potential Solutions
One of the first critical decisions that our team had to make was what protein of interest we would produce. In order to make this choice, our team developed the following decision matrix:
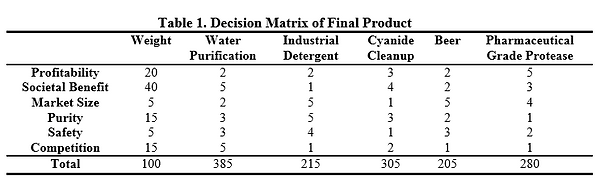
Specifics as to how each individual score was assigned can be found in the Analysis of Potential Solutions document on the Gallery and Links page of this website. Overall, the Water Purification enzymes was the top scoring, and has been chosen for our final product. Now that we had come up with our end product, it was time for us to design the process.
Analysis of Potential Solutions
Process Design
Specifics as to how each individual score was assigned can be found in the Analysis of Potential Solutions document on the Gallery and Links page of this website. Overall, the Water Purification enzymes was the top scoring, and has been chosen for our final product. Now that we had come up with our end product, it was time for us to design the process.
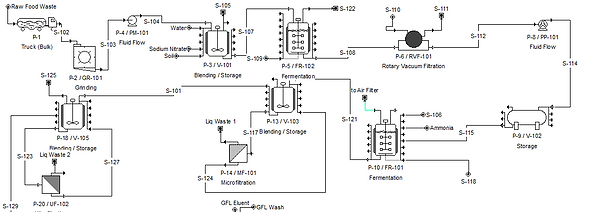
Our process design was constructed in SuperPro Designer ® software for design of chemical and biological processes. Below is the full design, from truck delivery of food waste to our biological plant, through fermentation and enzyme production, and finally to downstream separation and processing. This design will be coupled with our fermentation results to analyze the economic and production level feasibility of the design.

Process Design
Laboratory Testing
Our process design was constructed in SuperPro Designer ® software for design of chemical and biological processes. Below is the full design, from truck delivery of food waste to our biological plant, through fermentation and enzyme production, and finally to downstream separation and processing. This design will be coupled with our fermentation results to analyze the economic and production level feasibility of the design.


First digestion in progress. Samples taken every 12 hourse to assess for acetic acid production
Micah innoculates the acetic acid produced from the digestion with B Subtilis in a proof of concept that the bacteria can grow on acetic acid alone
Our group has established the procedure and expected results of the anaerobic food waste digestion to produce acetic and lactic acid efficiently. Food waste was blended with water and inoculated with soil bacteria, and digested in hot water baths at 37 degrees Celsius for three days. Samples were taken every 12 hours and anaylsed via High Performance Liquid Chromatography (HPLC) for levels of acetic acid, lactic acid, ethanol, and other fermentation byproducts.
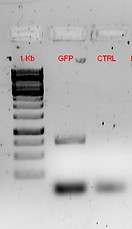
Genes encoding green fluorescent protein (gfp) and thiosulfate reductase (phsABC) have been amplified and isolated from strains of Escherichia coli and Salmonella enterica, respectively. The genes have been inserted into plasmid pWNP43N, generously provided by the laboratory of Dr. Percival Zhang (source). These plasmids have been taken up by Bacillus subtilis cells and grown in bench scale environments.
Competent cells expressing proteins have been grown on plates with chloramphenicol resistance and inoculated into bioreactors containing digestate resulting from the anaerobic digestion of food waste, and quantitative data from expression of gfp has been used in our SuperPro design, with supplementary experiments of cell growth that overexpresses gfp and phsABC as proof-of-concepts.
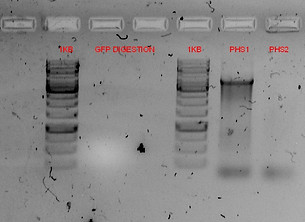
The wells labeled GFP Digestion are both single stranded fragments, which do not show up on a gel plate. The PHS 1 and 2 wells show that our PHS gene is only present in the first sample.
Amplification of the gene for gfp run on gel electrophoresis.

Cara prepares plates with antibiotics to select only cells that have successfully taken in the plasmid
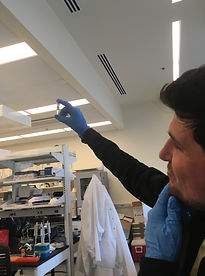
Ryan searches for signs of GFP and life in a test tube.
Economic Analysis
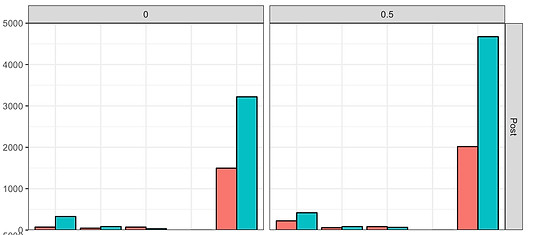
Above are the results from the HPLC analysis of the digestions using 0 and 0.5 grams of added nitrates. The 0.5 grams was chosen for our design because of the large increases in acetate and lactate concentration, which are necessary substrates for bacillus growth.

The bioreactor inoculated with bacillus. The reactor contains sensors for pH, temperature, and dissolved oxygen, and equipped with a rotor, oxygen pump, and heating pads to maintain a homogeneous mixture.
Through our Biological Process Plant Design class, our team developed our SuperPro Designer process design, and used it to answer a number of questions regarding the economics of our process. Below is the Gantt Chart developed in Super Pro for the entire process:

Each color in the Gantt chart represents another run through the process. Each run takes approximately 11 days, with the process bottleneck being the first fermentation reactor.
Our first goal of the economic analysis was to come up with fixed capital investment, cost allocations, payback period, and return on investment. The calculations below were based on approximations made during the first semester, which were adjusted after laboratory testing for fermentation yields.

Results of the economic analysis, with first set $5,000/kg of protien.
Our team was interested in finding the changes in ROI, NPV and PBP based off of different selling prices, as we were interested in finding key points, such as selling price with 0 ROI, or 0 NPV.
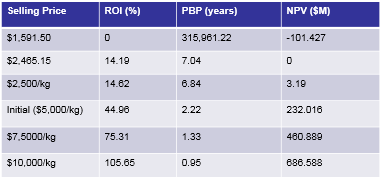
Our team investigated the important economic data points based on varied selling points, so that different profits could be anticipated for future application.